pointSpectra
pointSpectra is a low-cost, open-source alternative for measuring absorbance of the analyte at specific wavelengths of light. This project is initially made to detect various snake species venom in human blood to do a one-to-one mapping of venom and the snake species using Venom Detection Kit. Nevertheless, it can be used for any analyte.

Note: The whole setup can be built with BOM cost not more than 1000 INR i.e. 15 USD.
Background
pointSpectra works on the Beer-Lambert law which states that the quantity of light absorbed by a substance dissolved in a fully transmitting solvent is directly proportional to the concentration of the substance and the path length of the light through the solution. The below is the formulation for absorbance of an analyte:
Transmittance:
T = I / I0
% Transmittance: %T = 100 T
Absorbance:
A = log10 (I0/I)
A = log10 (1/T) = -log10 (T)
A = log10 (100/%T)
A = 2 - log10 (%T)
Requirements
Hardware requirements:
Software requirements:
Mechanical requirements:
- 3D-printed case
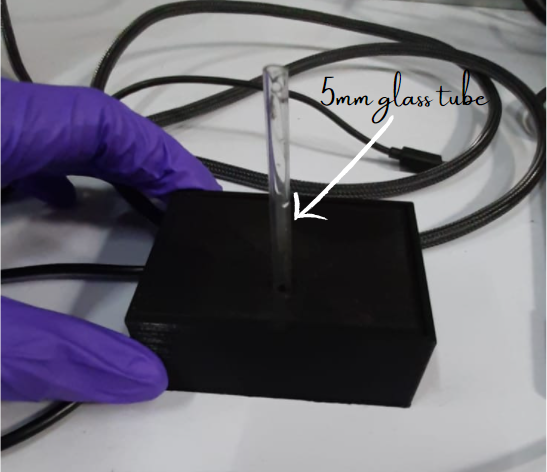
- A glass testtube of diameter 5mm.
- Four M3 screws.
Making
The setup mainly invoves three boards - Tx Board, Rx Board and Arduino nano. Tx board has wavelength-specific LED emitters that goes through mechanical slits of the 3D printed case in which a glass tube is inserted orthogonally and the unabsorbed light beams coming through the tube, fall on Rx board which has photo diode array that converts the light intensity into proportional frequency. This signal is caputured by the nano-microcontroller, further processing of the data is done and it’s followed by plotting the absorbance graph.

Tx Board:
- Use narrow-band, dominant wavelength LEDs as light sources for a specific wavelength absorbance.
- 6-point light sources.
- Adjust the current limiting resistor properly by using forward voltage and current of LEDs, and the supply voltage.
Spectral Response of 520nm LED:


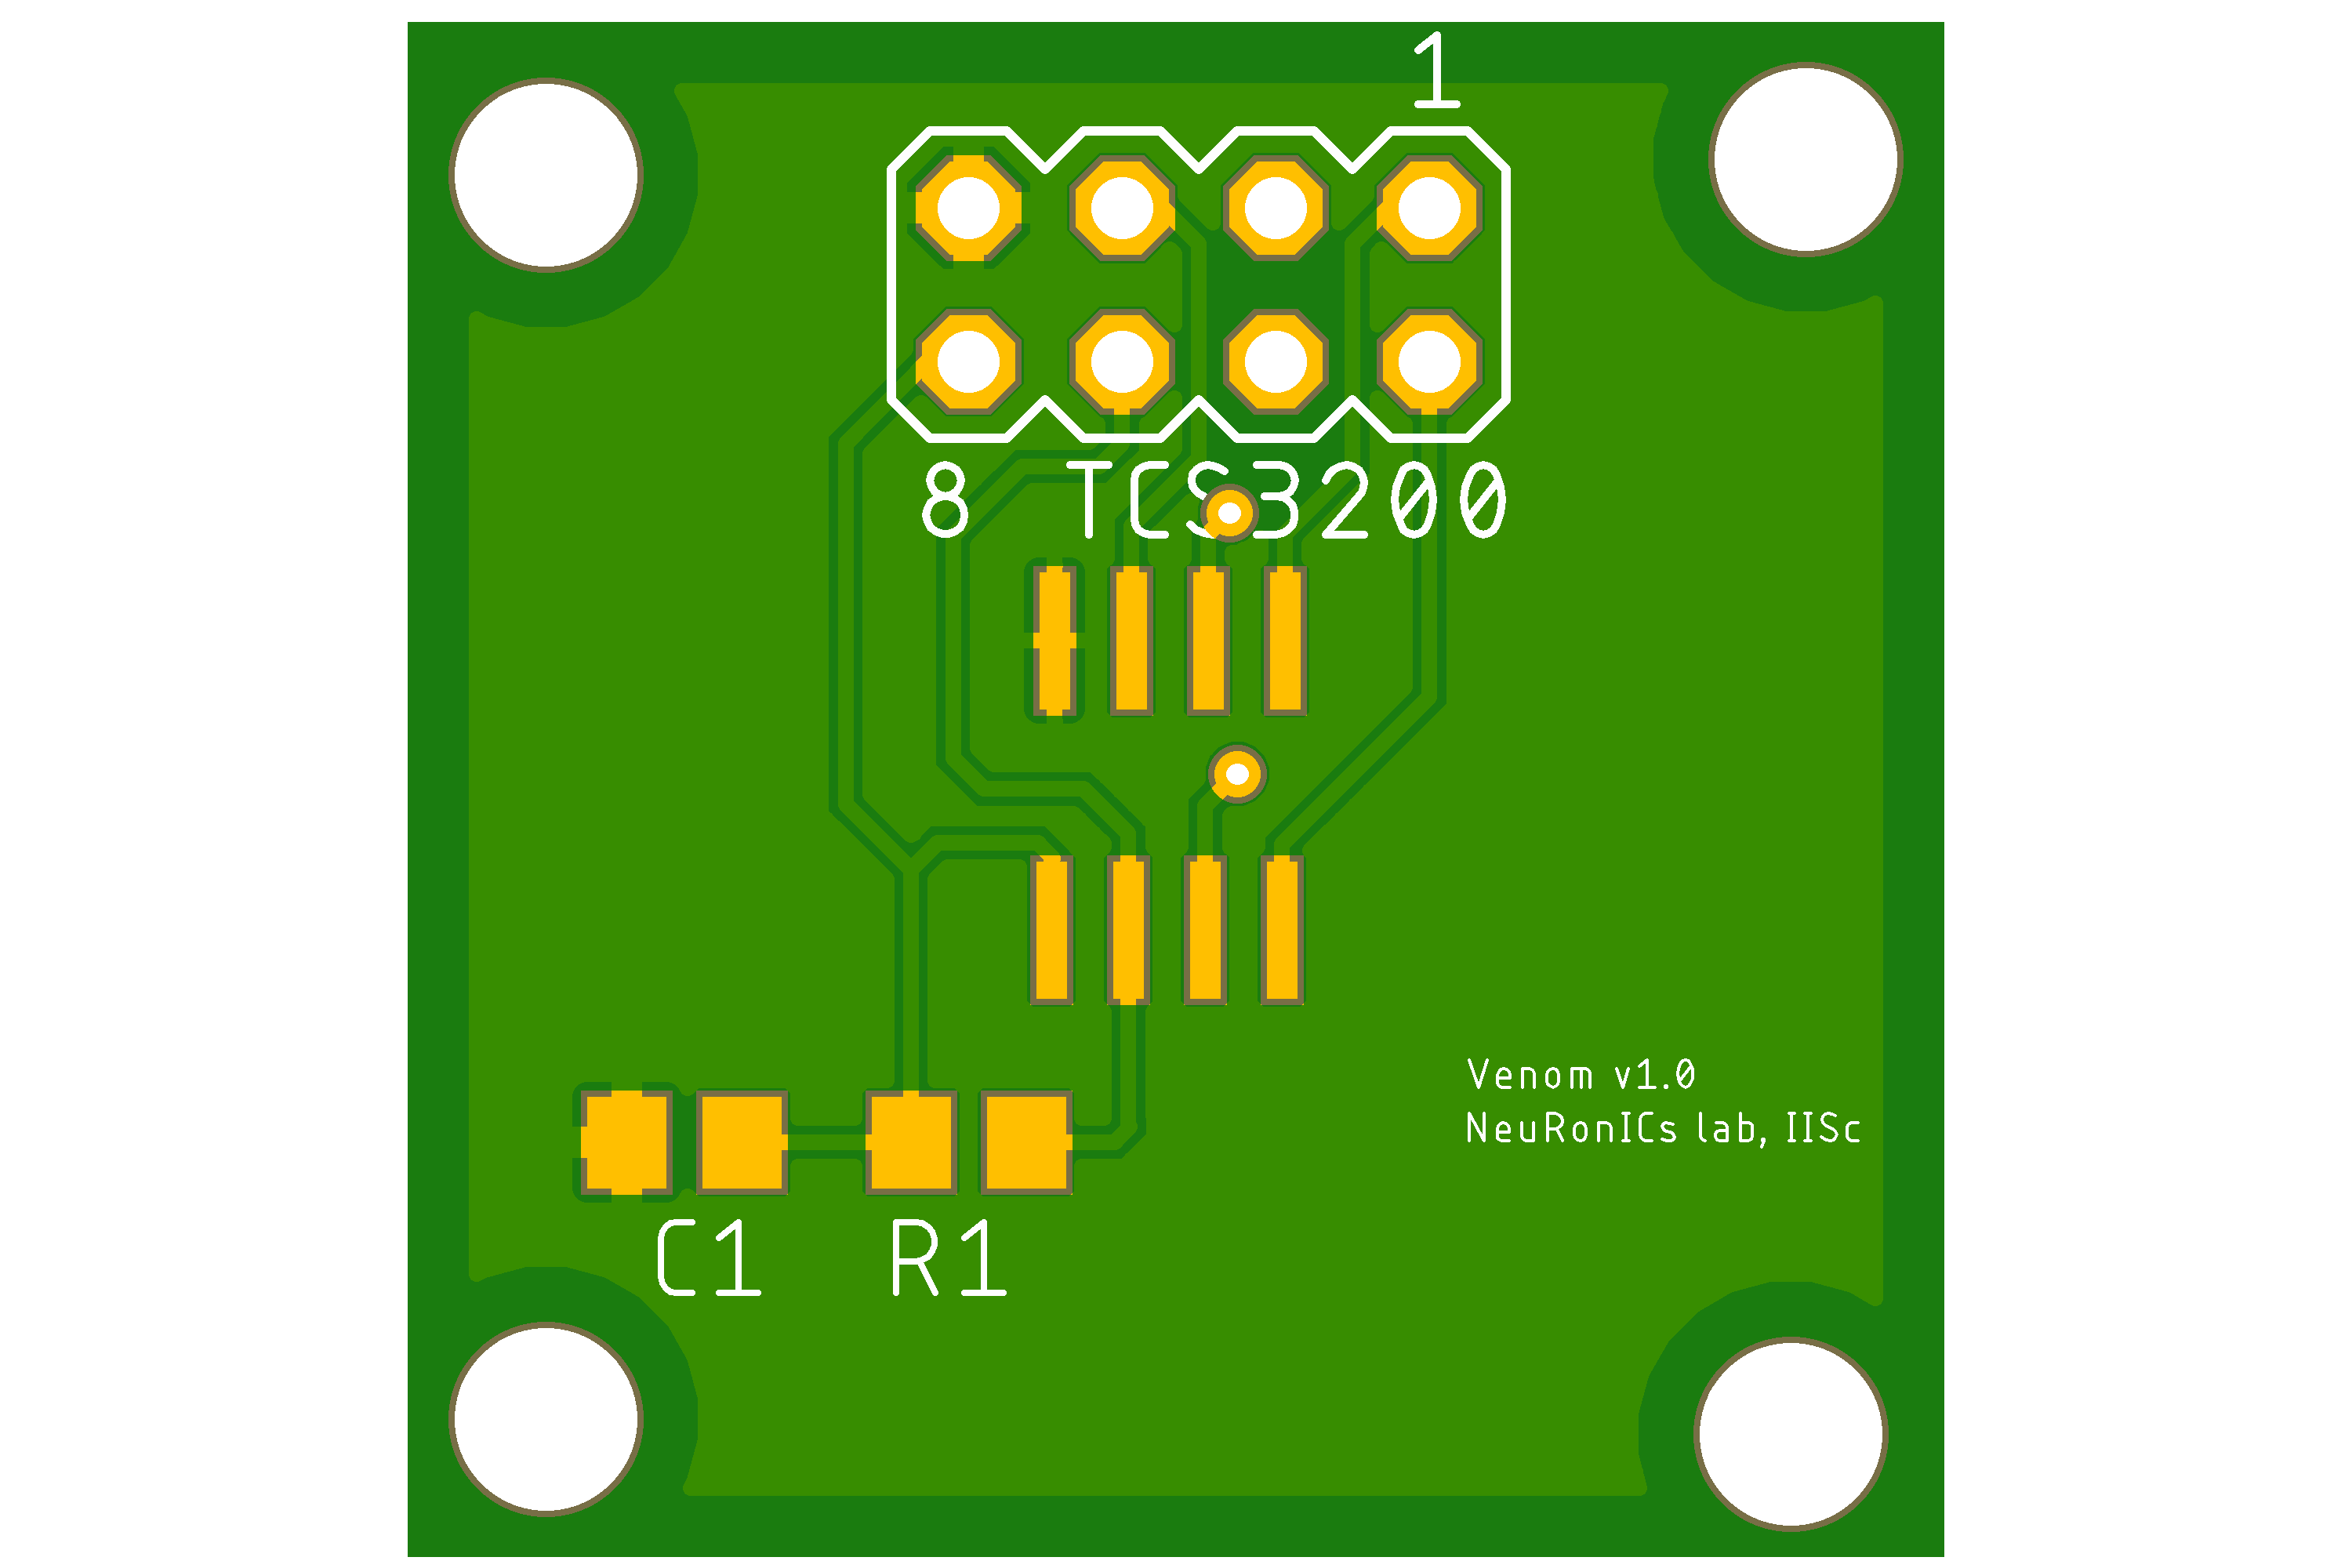
Rx Board:
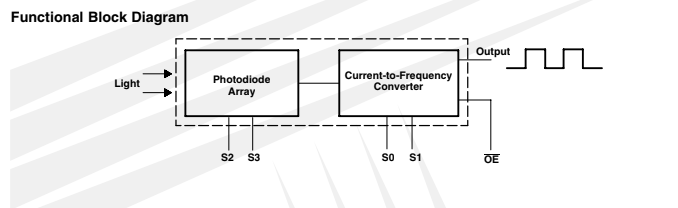
- TCS3200 - Light (irradiance) to frequency converter.
- 8 x 8 array of photodiodes.
- 16 blue filters, 16 green filters, 16 red filters and 16 clear filters.
- The output is a square wave (50% duty cycle) with frequency directly proportional to luminous intensity (irradiance).
Functional Block Diagram:
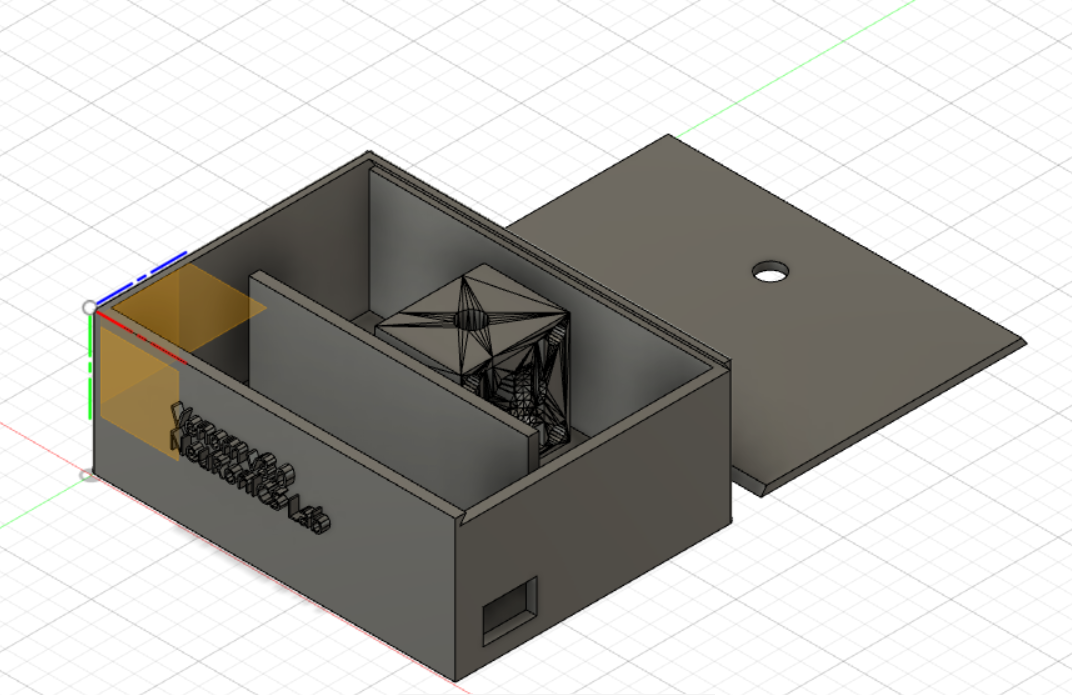
3D printed case:
Use the cheat sheet of if you are not familiar with 3D printing. We have used fractal works extended printer and print time with infill 50% and layer height 0.2 is 8 hrs.
Pin connections:
| Tx | Arduino nano |
|---|---|
| LED_520 | D11 |
| LED_560 | D3 |
| LED_600 | D4 |
| LED_630 | D10 |
| LED_660 | D2 |
| GND | GND |
| Rx | Arduino nano |
|---|---|
| S0 | D5 |
| S1 | D6 |
| S2 | D7 |
| S3 | D8 |
| sensorOut | D9 |
Firmware
The firmware code makes the luminous intensity of LEDs same by adjusting the average current to the LEDs using Pulse Width Modulation (PWM) signals. Standard signal conditioning like moving average on the real-time data is preformed to avoid sharp transition due to external environment. Calibration methods - zero referencing and range mapping are used. It outputs an absorbance graph of an analyte by interpolating the sensor reading of 6 narrow band LED inputs. Flash the Firmware using Arduino IDE.
Results
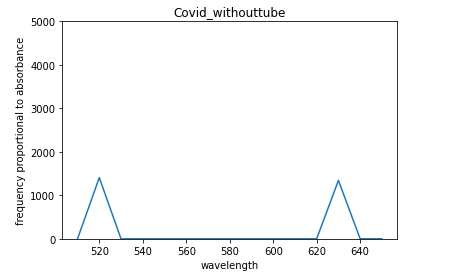
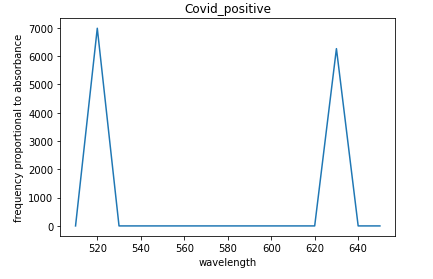
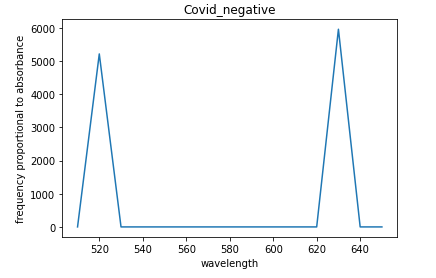
We have measured the absorbance of gold nanoparticles with COVID-19 positive and negative samples at 520nm and 630nm (2-points) and repeated it a couple of times, the results are as below:
Publication
S C G Kiruba Daniel, Poojitha S Pai, Hemanth Reddy Sabbella, Kumar Singh, Ambica Rangaiah, Shantala Gowdara Basawarajappa, Chetan Singh Thakur, “Handheld, low-cost, aptamer-based sensing device for rapid SARS-CoV-2 RNA detection using novelly synthesized gold nanoparticles.” IEEE Sensors Journal, 2022
Note: We have been working to test more analytes to validate the robustness of pointSpectra, stay tuned to this space for more results.
pointSpectra is developed in NeuRonICS lab, DESE, IISc under the guidance of Dr. Chetan Singh Thakur. For any clarification and details about replication please contact the author at hemanthrs@iisc.ac.in
Team members: Dr. S. C. G. Kiruba Daniel, Poojitha S Pai